How to Install Grafana on Linux Servers
To Install Grafana on Linux Servers
Grafana is open source data visualization and monitoring suite that offers support for Graphite, Elasticsearch, Prometheus, and many more databases. It has a beautiful dashboard and metric analytics, with the ability to manage and create your own dashboard for your apps or infrastructure performance monitoring. Installing Grafana is quite simple and this tutorial covers the method to install Grafana on Linux servers.
Install Grafana on CentOS 7
Add new Grafana repository by creating a new .repo file in the ' yum.repos.d' directory. Go to the directory and create a new file dubbed ' grafana.repo'
[root@linuxhelp ~]# cd /etc/yum.repos.d/
[root@linuxhelp yum.repos.d]# nano grafana.repo
And add the following.
[grafana]
name=grafana
baseurl=https://packagecloud.io/grafana/stable/el/7/$basearch
repo_gpgcheck=1
enabled=1
gpgcheck=1
gpgkey=https://packagecloud.io/gpg.key https://grafanarel.s3.amazonaws.com/RPM-GPG-KEY-grafana
sslverify=1
sslcacert=/etc/pki/tls/certs/ca-bundle.crt
Save the change and the exit the editor.
Once it is done, install Grafana using the following yum command.
[root@linuxhelp yum.repos.d]# yum -y install grafana
Loaded plugins: fastestmirror, langpacks
grafana/x86_64/signature                                                      |  836 B  00:00:00
Retrieving key from https://packagecloud.io/gpg.key
Importing GPG key 0xD59097AB:
 Userid     : " packagecloud ops (production key) < ops@packagecloud.io> "
 Fingerprint: 418a 7f2f b0e1 e6e7 eabf 6fe8 c2e7 3424 d590 97ab
 From       : https://packagecloud.io/gpg.key
Retrieving key from https://grafanarel.s3.amazonaws.com/RPM-GPG-KEY-grafana
grafana/x86_64/signature                                                      | 1.0 kB  00:00:01 !!!
grafana/x86_64/primary                                                        | 3.7 kB  00:00:02
Loading mirror speeds from cached hostfile
 * base: mirror.dhakacom.com
 * extras: mirror.dhakacom.com
 * updates: mirror.dhakacom.com
grafana                                                                                        29/29
.
.
POSTTRANS: Running script
  Verifying  : grafana-4.6.3-1.x86_64                                                            1/1

Installed:
  grafana.x86_64 0:4.6.3-1

Complete!
After the installation, you should reload the systemd manager configuration and then start the Grafana service.
[root@linuxhelp yum.repos.d]# systemctl daemon-reload
Next, start Grafana and then enable it to run automatically every time the system boots up.
[root@linuxhelp yum.repos.d]# systemctl start grafana-server
[root@linuxhelp yum.repos.d]# systemctl enable grafana-server
Created symlink from /etc/systemd/system/multi-user.target.wants/grafana-server.service to /usr/lib/systemd/system/grafana-server.service.
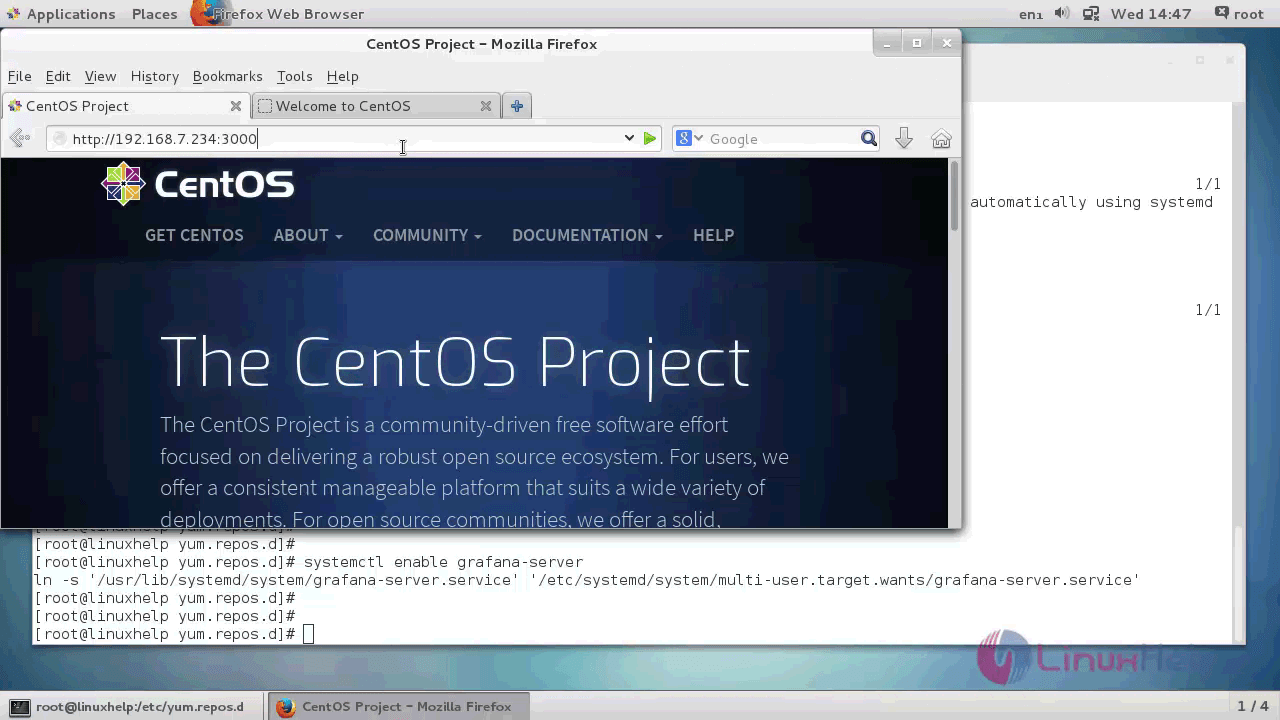
Now, you need to change the admin password. Continue the process via a browser. Enter the Grafana server IP address (with port 3000) as URL: http://server-ip:3000
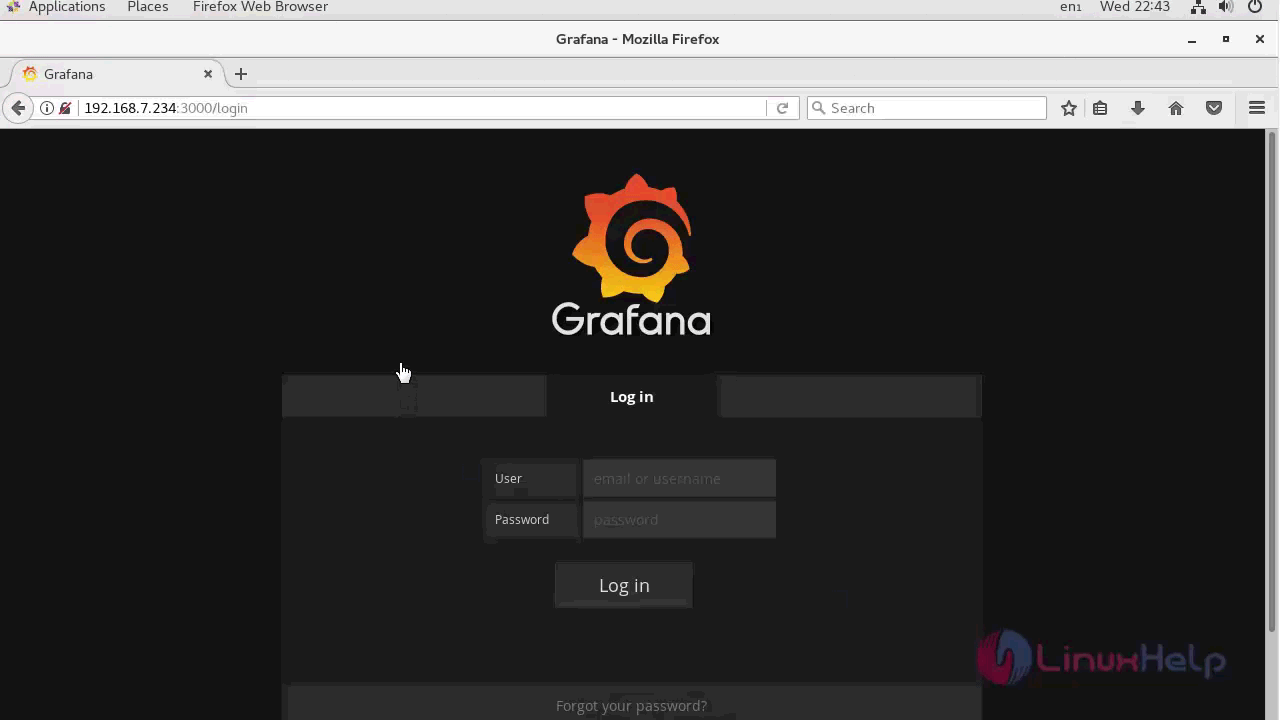
Log in to the Grafana Dashboard using default user ' admin' and password ' admin.'
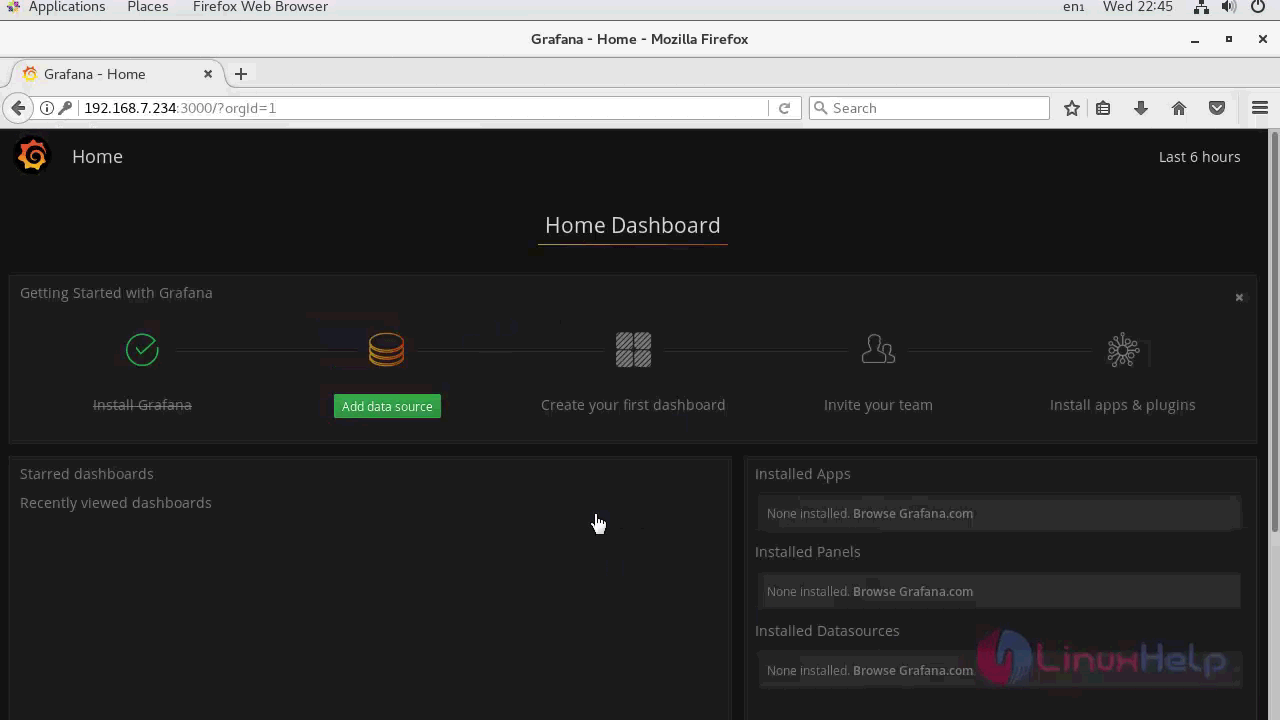
You will see Grafana Dashboard.
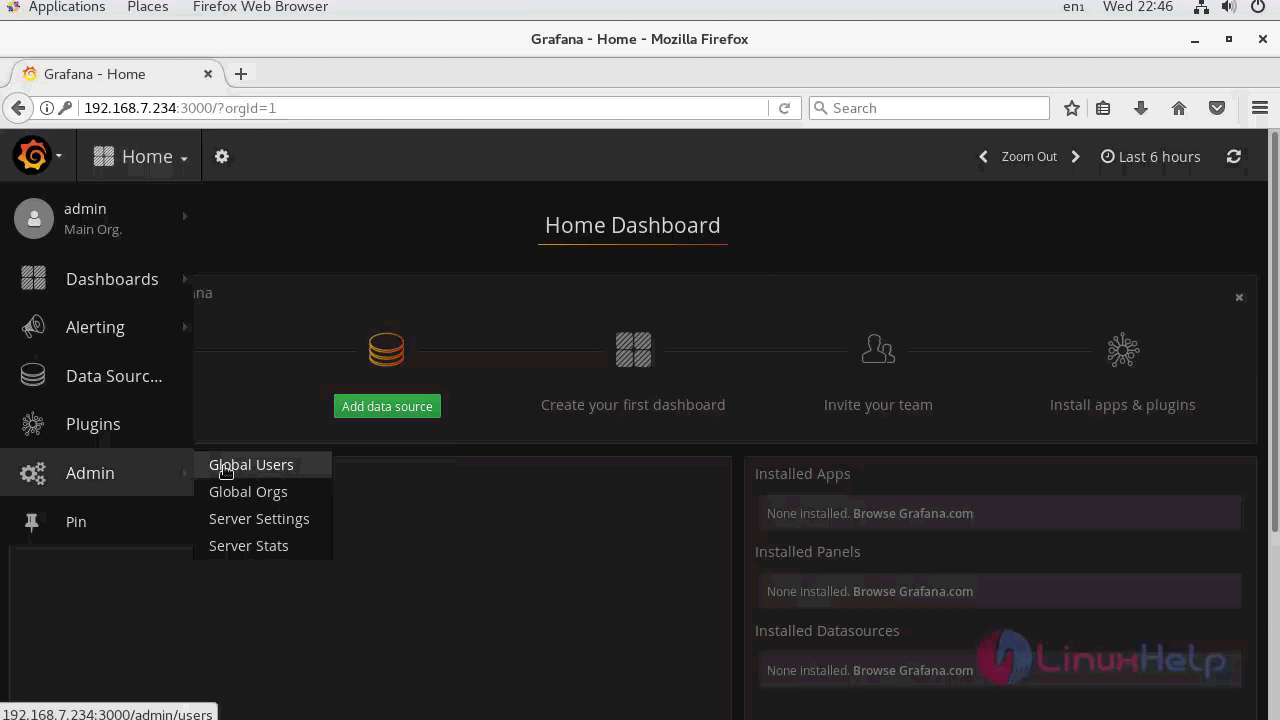
To change the default username and password for Grafana, click on the Grafana logo on the top left and then click the ' Admin' menu, then choose the ' Global Users.'
You will see the list of users. Click on ' Edit' menu to edit the username and password.
Type your new username and password, click on the green ' Update' button to confirm.
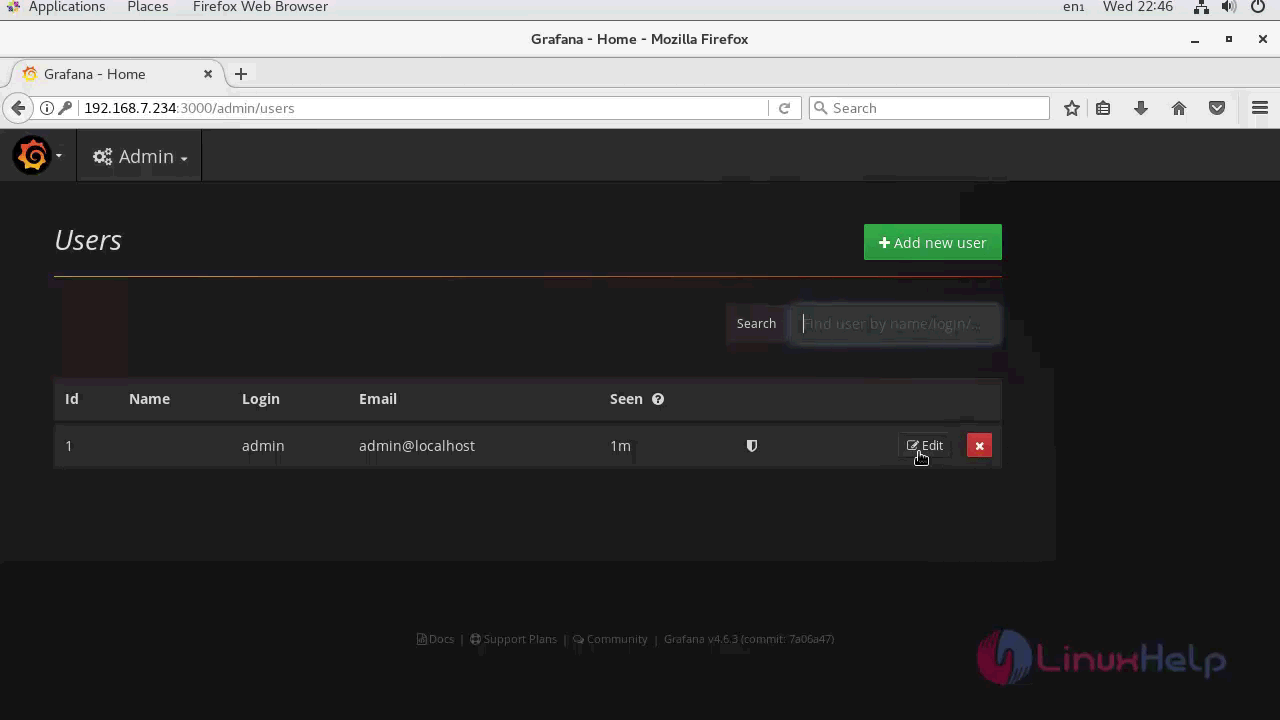
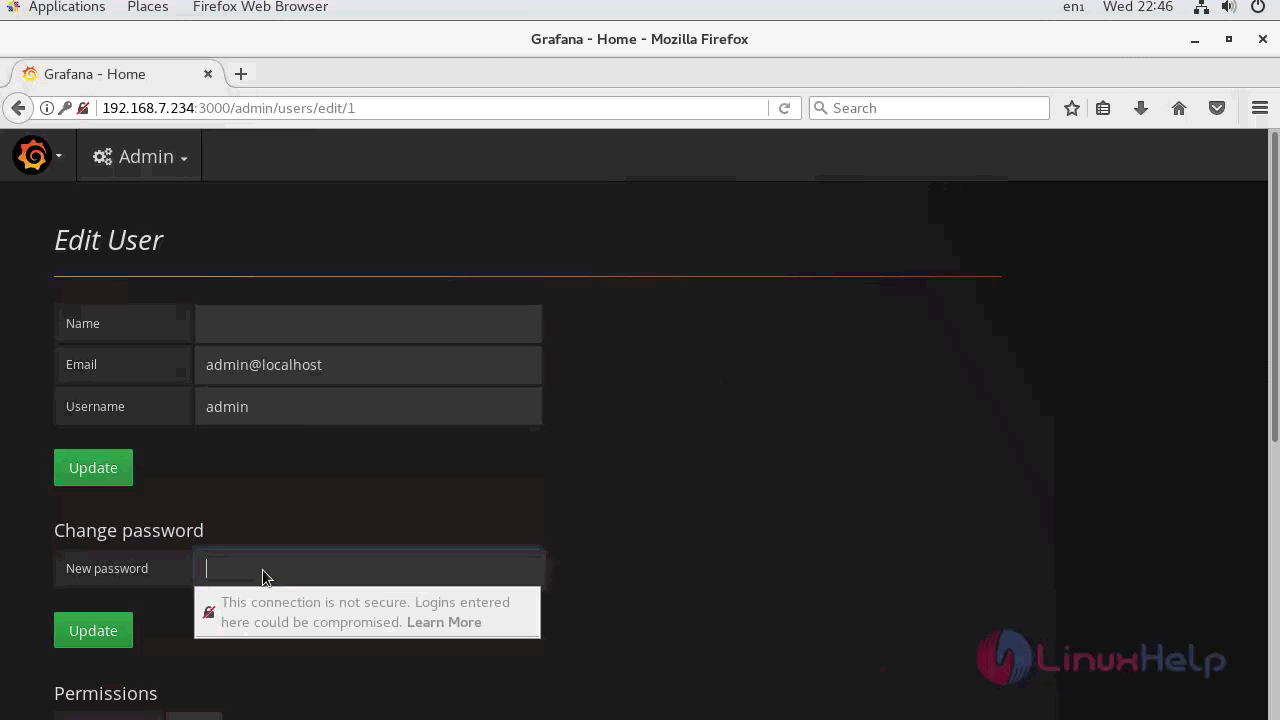
Grafana default user and password has been changed.
You should also install the plugins, and for that Grafana provides a command line tool dubbed ' grafana-cli' . Run it to see the instruction.
[root@linuxhelp yum.repos.d]# grafana-cli
NAME:
   Grafana cli -

USAGE:
   grafana-cli [global options] command [command options] [arguments...]

VERSION:
   4.6.3

AUTHOR(S):
   Grafana Project < https://github.com/grafana/grafana>

COMMANDS:
   plugins    Manage plugins for grafana
   admin    Grafana admin commands
   help, h    Shows a list of commands or help for one command

GLOBAL OPTIONS:
   --pluginsDir " /var/lib/grafana/plugins"     path to the grafana plugin directory [$GF_PLUGIN_DIR]
   --repo " https://grafana.com/api/plugins"     url to the plugin repository [$GF_PLUGIN_REPO]
   --pluginUrl                     Full url to the plugin zip file instead of downloading the plugin from grafana.com/api [$GF_PLUGIN_URL]
   --insecure                    Skip TLS verification (insecure)
   --debug, -d                    enable debug logging
   --help, -h                    show help
   --version, -v                print the version
And to get a list of all available plugins in the repository, use the following command.
root@linuxhelp yum.repos.d]# grafana-cli plugins list-remote
id: abhisant-druid-datasource version: 0.0.5
id: adremsoft-netcrunch-app version: 1.0.0
id: alexanderzobnin-zabbix-app version: 3.8.1
id: ayoungprogrammer-finance-datasource version: 1.0.0
id: belugacdn-app version: 1.2.0
.
.
id: sni-pnp-datasource version: 1.0.5
id: stagemonitor-elasticsearch-app version: 0.83.2
id: udoprog-heroic-datasource version: 0.1.0
id: vertamedia-clickhouse-datasource version: 1.3.1
id: vonage-status-panel version: 1.0.7
id: voxter-app version: 0.0.1
To install a plugin, use ' plugins install' option as shown below.
[root@linuxhelp yum.repos.d]# grafana-cli plugins install grafana-clock-panel
installing grafana-clock-panel @ 0.0.9
from url: https://grafana.com/api/plugins/grafana-clock-panel/versions/0.0.9/download
into: /var/lib/grafana/plugins

✔ Installed grafana-clock-panel successfully
After the plugins are installed, you need to restart the Grafana service.
[root@linuxhelp yum.repos.d]# systemctl restart grafana-server
To get a list of all installed plugins on your system, use the following command.
[root@linuxhelp yum.repos.d]# grafana-cli plugins ls
installed plugins:
grafana-clock-panel @ 0.0.9
With this, the method to install Grafana on Linux servers comes to an end.
Comments ( 0 )
No comments available