• Categories
    Category
  • Categories
    Category
  • News
  • Tutorials
  • Forums
  • Tags
  • Users
Tutorial Comments FAQ Related Articles

How to Monitor Network Traffic using vnStati and vnStat

883

To Install vnStati and vnStat to Monitor Network Traffic on Debian 8.3

In this article we are going to learn how to install vnStati and vnStat to keep log of to monitor traffic. The latest version of vnStat is vnStat 1.13.

Features

  • After the system reboots, the Statistics remains available
  • Multiple output options
  • Generate png graphic output
  • Very light, consumes lite portion of system resources
  • Uses JSON for output
  • Monitor multiple network interfaces at same time
  • Sort the data by month, week, hour and day
  • Low CPU usage
  • Hide legend use -nl /
  • To alternative date/time text location use &ndash altdate
  • To customize the text in the image header use &ndash headertext
  • Interface bandwidth will reduce automatically

To Install vnStat and vnStati Network Monitoring Tools

Execute the following commands to install vnStat and vnStati Network Monitoring Tools.

root@linuxhelp:~# apt-get install vnstat vnstati
Reading package lists... Done
Building dependency tree       
Reading state information... Done
.
.
.
Processing triggers for systemd (215-17+deb8u3) ...
Processing triggers for man-db (2.7.0.2-5) ...
Setting up vnstat (1.12-2) ...
Setting up vnstati (1.12-2) ...
Processing triggers for systemd (215-17+deb8u3) ...

Create new database for network interface to monitor, after installation completed. Create vnstat directory into /var/lib/ directory.

root@linuxhelp:~# mkdir /var/lib/vnstat

Then run following command to create new database for present active network interface.

root@linuxhelp:~# vnstat --create -i eth0
Creating database for interface " eth0" ...
Info: ->  A new database has been created.

Restart the vnStat daemon, if it is currently running in order to start monitoring " eth0" .

root@linuxhelp:~# service vnstat restart

To update the stats in the database

Execute the below command to update the stats in the database.

root@linuxhelp:~# vnstat
Database updated: Tue Jun  7 13:32:55 2016

   eth0 since 07/06/16

          rx:  87.92 MiB      tx:  3.51 MiB      total:  91.43 MiB

   monthly
                     rx      |     tx      |    total    |   avg. rate
     ------------------------+-------------+-------------+---------------
       Jun ' 16     87.92 MiB |    3.51 MiB |   91.43 MiB |    1.32 kbit/s
     ------------------------+-------------+-------------+---------------
     estimated       397 MiB |      13 MiB |     410 MiB |

   daily
                     rx      |     tx      |    total    |   avg. rate
     ------------------------+-------------+-------------+---------------
         today     87.92 MiB |    3.51 MiB |   91.43 MiB |   15.36 kbit/s
     ------------------------+-------------+-------------+---------------
     estimated       154 MiB |       5 MiB |     159 MiB |

Using -h option, can check the hourly stats.

root@linuxhelp:~# vnstat -h
 eth0                                                                     13:37 
  ^                                                                    r        
  |                                                                 r  r  r     
  |                                                                 r  r  r     
  |                                                                 r  r  r     
  |                                                                 r  r  r     
  |                                                                 r  r  r     
  |                                                                 r  r  r     
  |                                                                 r  r  r     
  |                                                                 r  r  r     
  |                                                                 r  r  r     
 -+--------------------------------------------------------------------------->  
  |  14 15 16 17 18 19 20 21 22 23 00 01 02 03 04 05 06 07 08 09 10 11 12 13    
                                                                                
 h  rx (KiB)   tx (KiB)      h  rx (KiB)   tx (KiB)      h  rx (KiB)   tx (KiB) 
14          0          0    22          0          0    06          0          0
15          0          0    23          0          0    07          0          0
16          0          0    00          0          0    08          0          0
17          0          0    01          0          0    09          0          0
18          0          0    02          0          0    10          0          0
19          0          0    03          0          0    11     29,959      1,199
20          0          0    04          0          0    12     30,054      1,200
21          0          0    05          0          0    13     30,022      1,200

Use -d option for daily stats.

root@linuxhelp:~# vnstat -d

 eth0  /  daily

         day         rx      |     tx      |    total    |   avg. rate
     ------------------------+-------------+-------------+---------------
      07/06/16     87.92 MiB |    3.51 MiB |   91.44 MiB |   15.26 kbit/s
     ------------------------+-------------+-------------+---------------
     estimated       153 MiB |       5 MiB |     158 MiB |

Use -w option for weekly stats.

root@linuxhelp:~# vnstat -w

 eth0  /  weekly

                      rx      |     tx      |    total    |   avg. rate
   ---------------------------+-------------+-------------+---------------
    last 7 days     87.93 MiB |    3.51 MiB |   91.45 MiB |    1.32 kbit/s
   current week     87.93 MiB |    3.51 MiB |   91.45 MiB |    5.52 kbit/s
   ---------------------------+-------------+-------------+---------------
      estimated       395 MiB |      13 MiB |     408 MiB |

To use vnStati tool to generate .png images.

root@linuxhelp:~# vnstati -s -i eth0 -o /root/Desktop/summary.png

vnstat tool

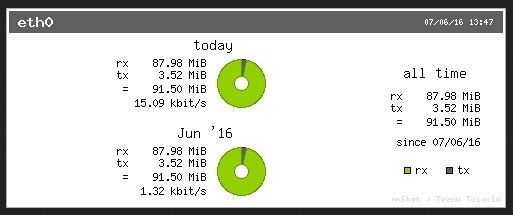
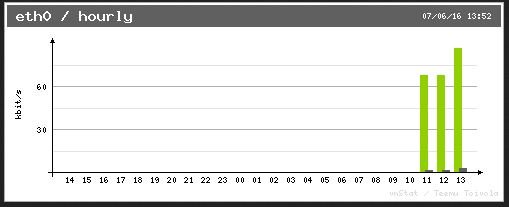
root@linuxhelp:~# vnstati -h -i eth0 -o /root/Desktop/summary1.png

vnstati

Use vnstat --help option to view all options in vnstat.

root@linuxhelp:~# vnstat --help
 vnStat 1.12 by Teemu Toivola 

         -q,  --query          query database
         -h,  --hours          show hours
         -d,  --days           show days
         -m,  --months         show months
         -w,  --weeks          show weeks
         -t,  --top10          show top10
         -s,  --short          use short output
         -u,  --update         update database
         -i,  --iface          select interface (default: eth0)
         -?,  --help           short help
         -v,  --version        show version
         -tr, --traffic        calculate traffic
         -ru, --rateunit       swap configured rate unit
         -l,  --live           show transfer rate in real time

See also " --longhelp" for complete options list and " man vnstat" . You can find more information about vnStat in the man page of tool.

Tags:
jacob
Author: 

Comments ( 0 )

No comments available

Add a comment

Frequently asked questions ( 5 )

Q

where to download latest version of vnstat?

A

refer the following link to download the latest version of vnstat
https://humdi.net/vnstat/vnstat-1.18.tar.gz

Q

Where to refer the documentation for vnstat command?

A

use the following link for reference,
https://humdi.net/vnstat/

Q

any other command like vnstat available in linux?

A

you can try
nload
iftop
iptraf
bmon

Q

what are all the features of monitoring network traffic?

A

After the system reboots, the Statistics remains available
Multiple output options
Generate png graphic output
Very light, consumes lite portion of system resources
Uses JSON for output
Monitor multiple network interfaces at same time
Sort the data by month, week, hour and day

Q

How to install vnstati and vnstat package in ubuntu?

A

use the following command to install vnstat and vnstati
# apt-get install vnstat vnstati

Related Tutorials in How to Monitor Network Traffic using vnStati and vnStat

Related Tutorials in How to Monitor Network Traffic using vnStati and vnStat

How to add Host into Nagios Server
Nov 1, 2016
How to install LibreNMS in Ubuntu
Oct 20, 2016
How to install SARG on Ubuntu 16.04
Oct 20, 2017
How to use Ntopng using Squid proxy server
Sep 2, 2017
How to install Ntopng on CentOS 7
Jul 24, 2017
How to install Zenmap - Nmap Network Scanning Tool
Jul 22, 2016
How to install LibreNMS in Centos
Oct 21, 2016
How to install Netspeed Indicator in Ubuntu
Sep 28, 2016

Related Forums in How to Monitor Network Traffic using vnStati and vnStat

Related Forums in How to Monitor Network Traffic using vnStati and vnStat

Network Monitoring
systemtech class=
NMS tools on ubutun server 16.0.4
Mar 8, 2017
Monitoring tool
bentel263 class=
Ntopng configurations
Apr 11, 2020
Network Monitoring
systemtech class=
Installing LibreNMS
Mar 8, 2017
Network Monitoring
charmi class=
Test nagios configuration
Apr 4, 2018
Monitoring tool
eldhapearline class=
Nagios service failed to restart
Apr 16, 2018
Network Monitoring
noah class=
Analyze the wireless network report
Feb 20, 2021
Monitoring tool
ethenjames class=
Assement montoring tools for LINUX and WINDOWS
Oct 28, 2017
Network Monitoring
nathan class=
Nagios command execution failed
May 30, 2018
Back To Top!
Rank
User
Points

Top Contributers

userNamenaveelansari
135850

Top Contributers

userNameayanbhatti
92510

Top Contributers

userNamehamzaahmed
32150

Top Contributers

1
userNamelinuxhelp
31040

Top Contributers

userNamemuhammadali
24500
Can you help Gibbson ?
How do i run both nginx and apache in same instance on centos

Hi...,

my server is based centos operating system and my webserver is already running on Apache.... i need to run both apache and nginx on same instance ... please help me to implement this concept...

Networking
  • Routing
  • trunk
  • Netmask
  • Packet Capture
  • domain
  • HTTP Proxy
Server Setup
  • NFS
  • KVM
  • Memory
  • Sendmail
  • WebDAV
  • LXC
Shell Commands
  • Cloud commander
  • Command line archive tools
  • last command
  • Shell
  • terminal
  • Throttle
Desktop Application
  • Linux app
  • Pithos
  • Retrospect
  • Scribe
  • TortoiseHg
  • 4Images
Monitoring Tool
  • Monit
  • Apache Server Monitoring
  • EtherApe 
  • Arpwatch Tool
  • Auditd
  • Barman
Web Application
  • Nutch
  • Amazon VPC
  • FarmWarDeployer
  • Rukovoditel
  • Mirror site
  • Chef
Contact Us | Terms of Use| Privacy Policy| Disclaimer
© 2025 LinuxHelp.com All rights reserved. Linux™ is the registered trademark of Linus Torvalds. This site is not affiliated with linus torvalds in any way.