How To Monitor Apache Web Server Load and Page Statistics
How To Monitor Apache Web Server Load and Page Statistics
Monitoring the Apache Web Server Load and Page statistics is illustrated in this article with examples.
Introduction to mod_status
mod_status is an Apache module. It helps to monitor current httpd connections and web server load with an HTML interface which can be accessed via a web browser.
Apache’ s mod_status shows a plain HTML page which contains the information about current statistics of web server state.
CPU usage of Web server, Total number of incoming requests, Total number of bytes and counts server, Server Uptime, Server Load, PIDs with respective client and many more, Total Traffic and Total number of idle workers
Testing Environment
Operating System &ndash CentOS 6.5
Application &ndash Apache Web Server
IP Address &ndash 5.175.142.66
DocumentRoot &ndash /var/www/html
Apache Configuration file &ndash /etc/httpd/conf/httpd.conf (for Red Hat)
Default HTTP Port &ndash 80 TCP
To enable mod_status in Apache
mod_status is enabled by default with Apache installation.
To enable it in Apache configuration file
[root@linuxhelp ~]# vi /etc/httpd/conf/httpd.conf
Find the word mod_status
#LoadModule status_module modules/mod_status.so
The # symbol represents that the line is disabled. Now we have to enable this line by removing ‘ #’ symbol.
LoadModule status_module modules/mod_status.so
To configure mod_status:
Now find for the word “ Location”
# Allow server status reports generated by mod_status,
# with the URL of http://servername/server-status
# Change the " .example.com"  to match your domain to enable.
#
#
#    SetHandler server-status
#    Order deny,allow
#    Deny from all
#    Allow from .example.com
#
Remove the # symbols for the lines for Location directive, SetHandler and the directory restrictions according to your needs.
   SetHandler server-status
   Order allow,deny
   Deny from all
   Allow from all
In this configuration instead of giving Deny from all you can disable this line or made that line to exist in next line, because it may block your own servers ip itself.
It is a default configuration for default Apache web site. If an additional Apache virtual host is created then the above configuration will not work. Same configuration should be defined for each virtual host in Apache.
Example:
    ServerAdmin linuxhelp@example.com
    DocumentRoot /var/www/html/example.com
    ServerName example.com
    ErrorLog logs/example.com-error_log
    CustomLog logs/example.com-access_log common

   SetHandler server-status
   Order allow,deny
   Deny from all
   Allow from example.com
To Enable ExtendedStatus
It adds information to the statistics page like CPU usage, request per second, total traffic, etc.
Edit the httpd.conf file and find the word “ Extended” and remove the # symbol and set status On for ExtendedStatus directive.
# ExtendedStatus controls whether Apache will generate " full"  status
# Information (ExtendedStatus On) or just basic information (ExtendedStatus
# Off) when the " server-status"  handler is called. The default is Off.

ExtendedStatus On
To Restart Apache
Use the following commands, to check for the errors in the httpd.conf configuration
[root@linuxhelp ~]# httpd -t
Syntax OK
httpd service can be restarted after the syntax is OK.
[root@linuxhelp ~]# service httpd restart
Stopping httpd:                                        [  OK  ]
Starting httpd:                                          [  OK  ]
Now you can call the servers IP address in the browser to check for the apache main home page exists or not.
To Access mod_status Page
The Apache status page can be accessed via domain name with /server-status in the below URL.
http://serveripaddress/server-status
OR
http://< server-hostname> /server-status
The following page with ExtendedStatus enabled window appears.
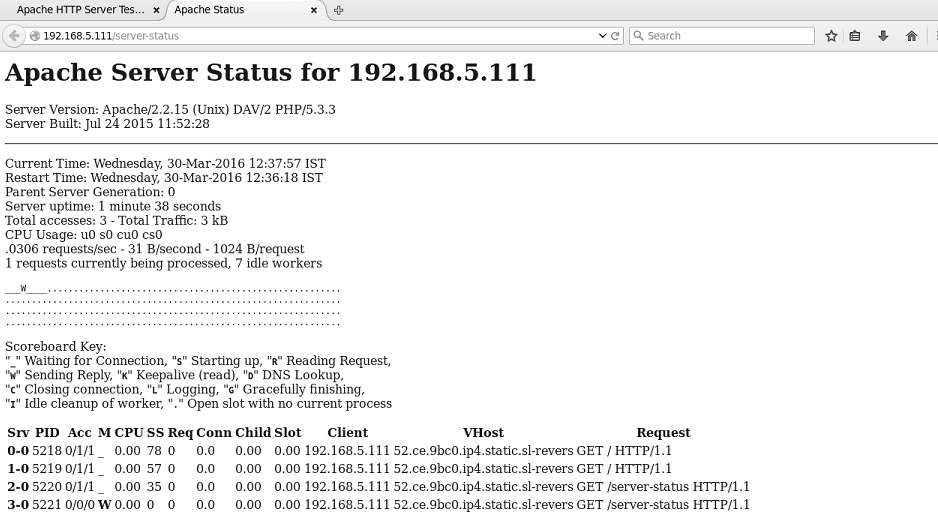
The HTML interface shows the information about the server up time and process id with respective machine. To view the updated statistics refresh the page for every 5 seconds. Add “ ?refresh=N” at the end of URL to refresh automatically.
http://serveripaddress/server-status/?refresh=5
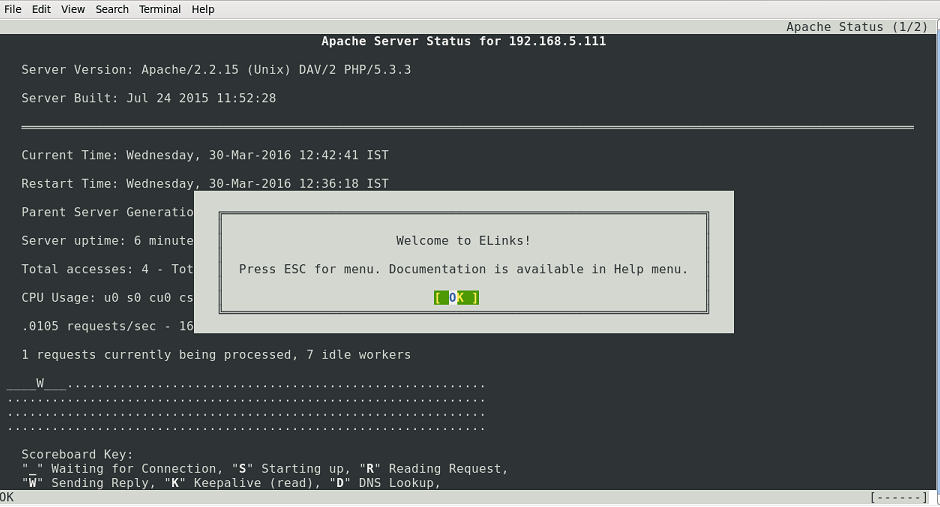
To View the Page using Command line
Use the special command-line browsers called links or lynx, to view the Apache status page. First install them using the following command.
We can use either links or lynx in the terminal,
[root@linuxhelp ~]# yum install links
Loaded plugins: fastestmirror, refresh-packagekit, security
Setting up Install Process
Determining fastest mirrors
 * base: centos.webwerks.com
 * extras: centos.webwerks.com
 * updates: centos.webwerks.com
base                                                                                                  | 3.7 kB     00:00
extras                                                                                                | 3.4 kB     00:00
updates                                                                                               | 3.4 kB     00:00
Resolving Dependencies
-->  Running transaction check
--->  Package elinks.x86_64 0:0.12-0.21.pre5.el6_3 will be installed
&hellip
&hellip
&hellip
Installed:
elinks.x86_64 0:0.12-0.21.pre5.el6_3
Complete!
Now you can get the same statistics on your terminal by using following command.
[root@linuxhelp ~]# links http://serveripaddress/server-status
OR
[root@linuxhelp ~]# lynx http://serveripaddress/server-status
Apache Server Status for 192.168.5.111
Server Version: Apache/2.2.15 (Unix) DAV/2 PHP/5.3.3
Server Built: Jul 24 2015 11:52:28

Current Time: Wednesday, 30-Mar-2016 12:37:57 IST
Restart Time: Wednesday, 30-Mar-2016 12:36:18 IST
Parent Server Generation: 0
Server uptime: 1 minute 38 seconds
Total accesses: 3 - Total Traffic: 3 kB
CPU Usage: u0 s0 cu0 cs0
.0306 requests/sec - 31 B/second - 1024 B/request
1 requests currently being processed, 7 idle workers
&hellip
&hellip
&hellip
Apache/2.2.15 (CentOS) Server at 192.168.5.111 Port 80
Thus the Apache web servers load and its statistics is configure and shown in CentOS 6.7
Comments ( 0 )
No comments available