How to install atop in Linux
Monitor Logging Activity - Using atop
' atop' is a Linux process monitor tool which is similar to top, but provides more detailed information about the system state, as well as the ability to save its output to a file periodically. It shows how your system’ s hardware resources including CPU, memory, disk, and network are occupied.
Advantages
- Shows resource usage of ALL processes, even those that are closed/completed.
- Monitors threads within processes & ignores processes that are unused.
- Accumulates resource usage for all processes and users with the same name.
- Highlights critical resources using colors (red).
- Will add or remove columns as the size of the display window changes.
- Includes disk I/O and network utilization.
- Uses netatop kernel module to monitor TCP & UDP and network bandwidth.
To Install
Run the following command to install atop packages.
[root@linuxhelp Desktop]# yum install atop
Loaded plugins: aliases, changelog, fastestmirror, kabi, presto, refresh-packagekit, security, tmprepo, verify,
              : versionlock
Loading support for CentOS kernel ABI
Setting up Install Process
Loading mirror speeds from cached hostfile
 * base: centos.excellmedia.net
 * epel: mirror.rise.ph
.
.
.
Running Transaction
  Installing : atop-1.27-2.el6.x86_64                                                                          1/1
  Verifying  : atop-1.27-2.el6.x86_64                                                                          1/1

Installed:
  atop.x86_64 0:1.27-2.el6
Complete!
After installation is completed, add atop into system start up.
[root@linuxhelp Desktop]# chkconfig &ndash add atop
[root@linuxhelp Desktop]# chkconfig atop on &ndash level 235
Run the atop command without using options.
[root@linuxhelp Desktop]# atop
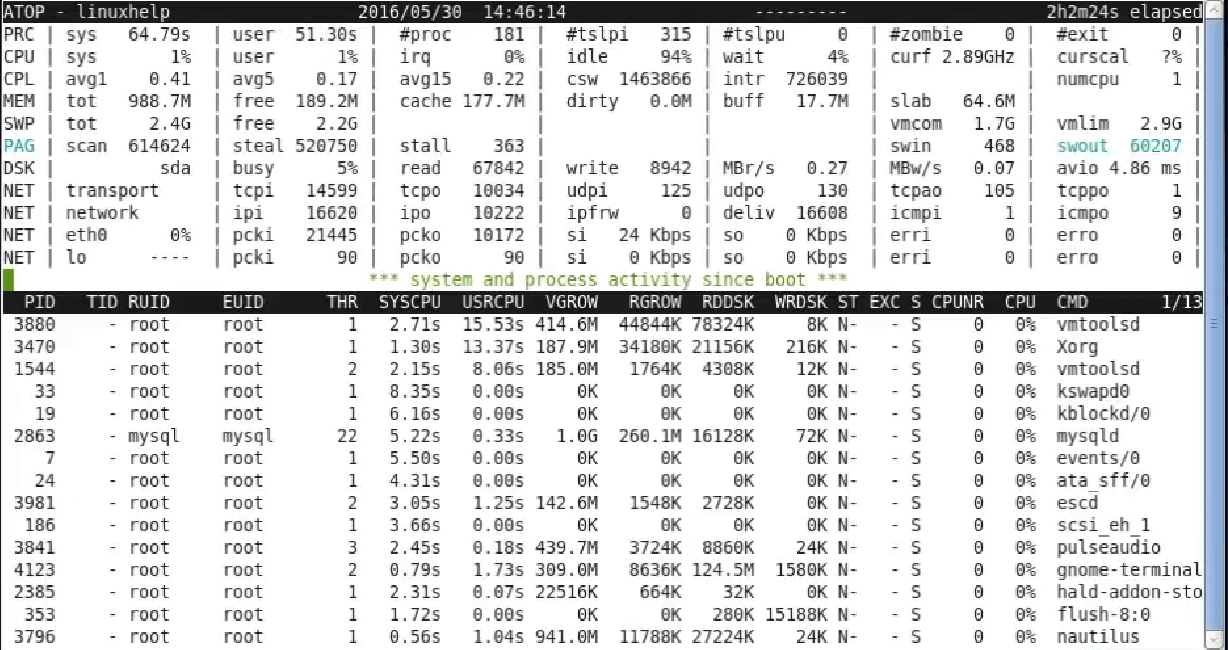
The terminal will show the updates after every 10 seconds.
Using ‘ m’ option
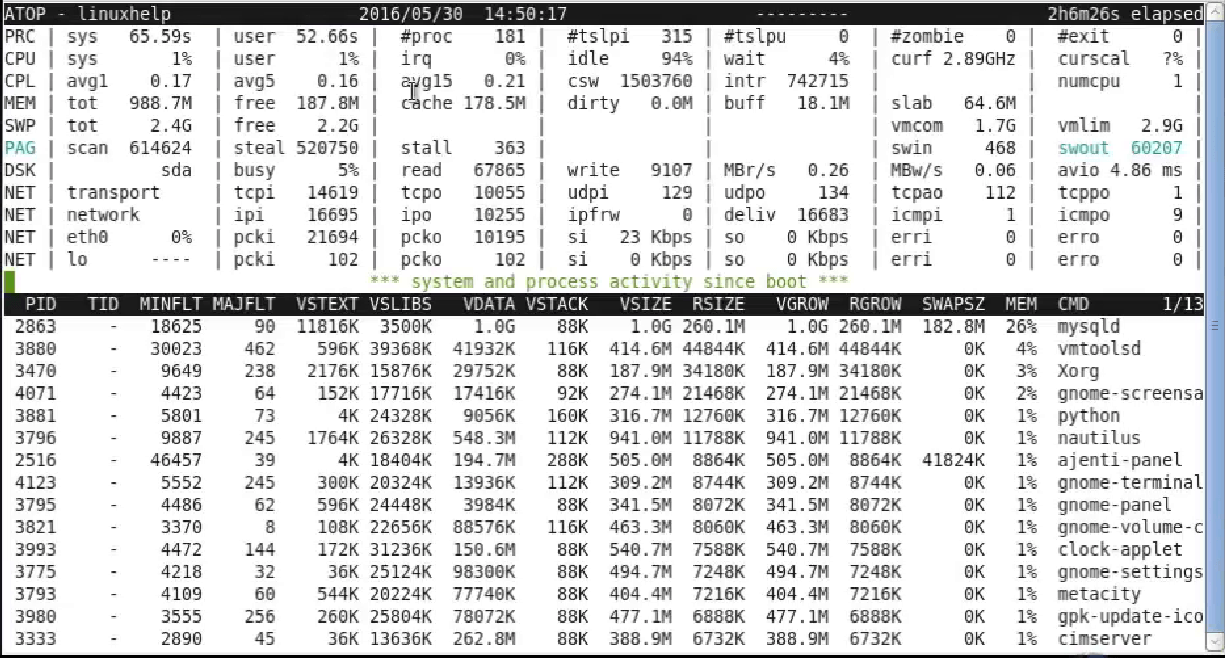
Using this ' m ' option, it will display the memory relation information about all running process.
[root@linuxhelp Desktop]# atop -m
Using ‘ a’ option
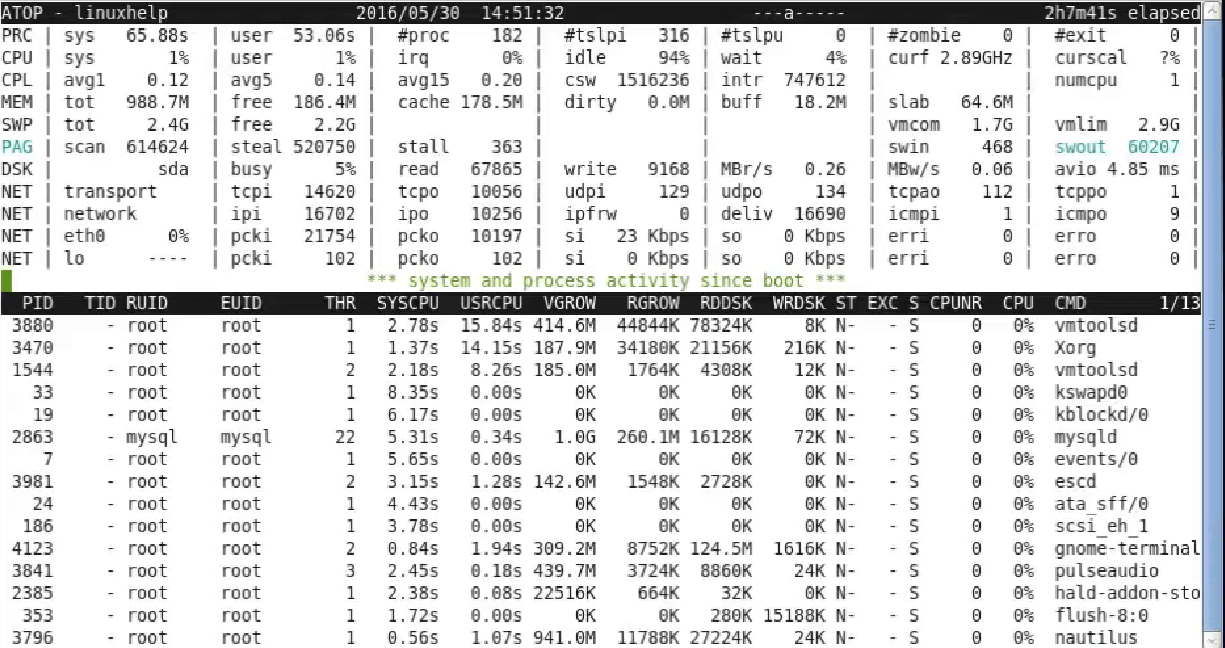
By using this ‘ a’ option, it will show the status of all current running process.
[root@linuxhelp Desktop]# atop -a
Using ‘ s’ option
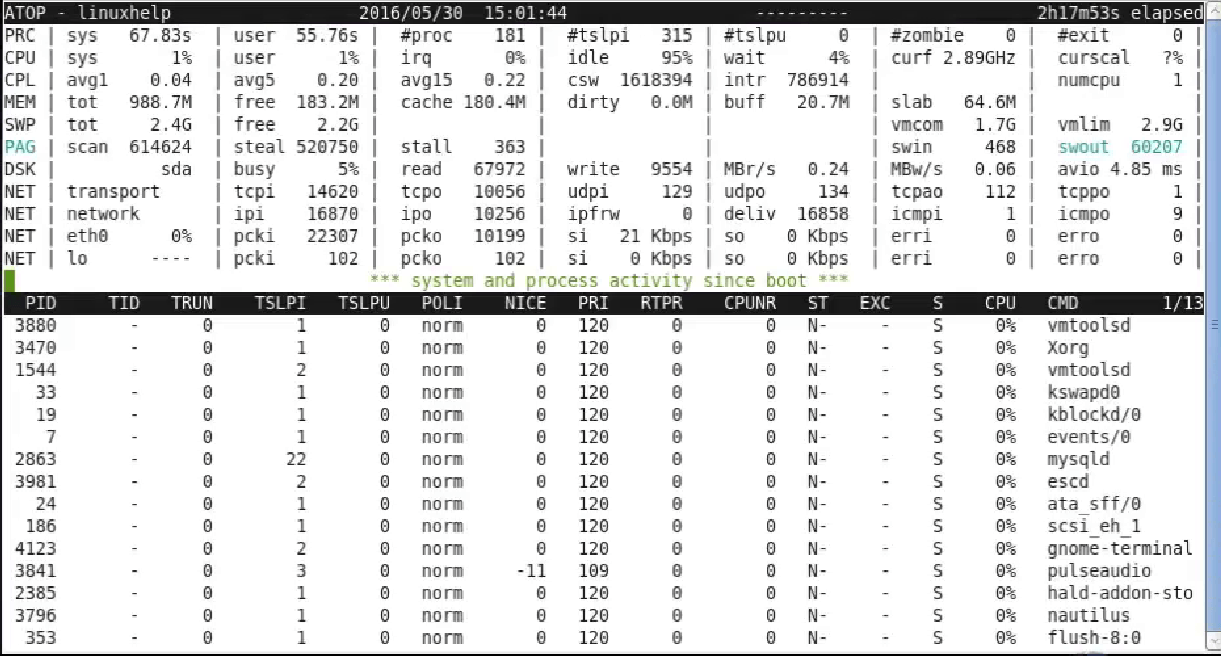
It displays the scheduling task information.
[root@linuxhelp Desktop]# atop -s
Using ‘ d’ option
It will display the disk activities on the system. Disk activity is shown as amount of data that is being transferred by read/write columns.
[root@linuxhelp Desktop]# atop -d
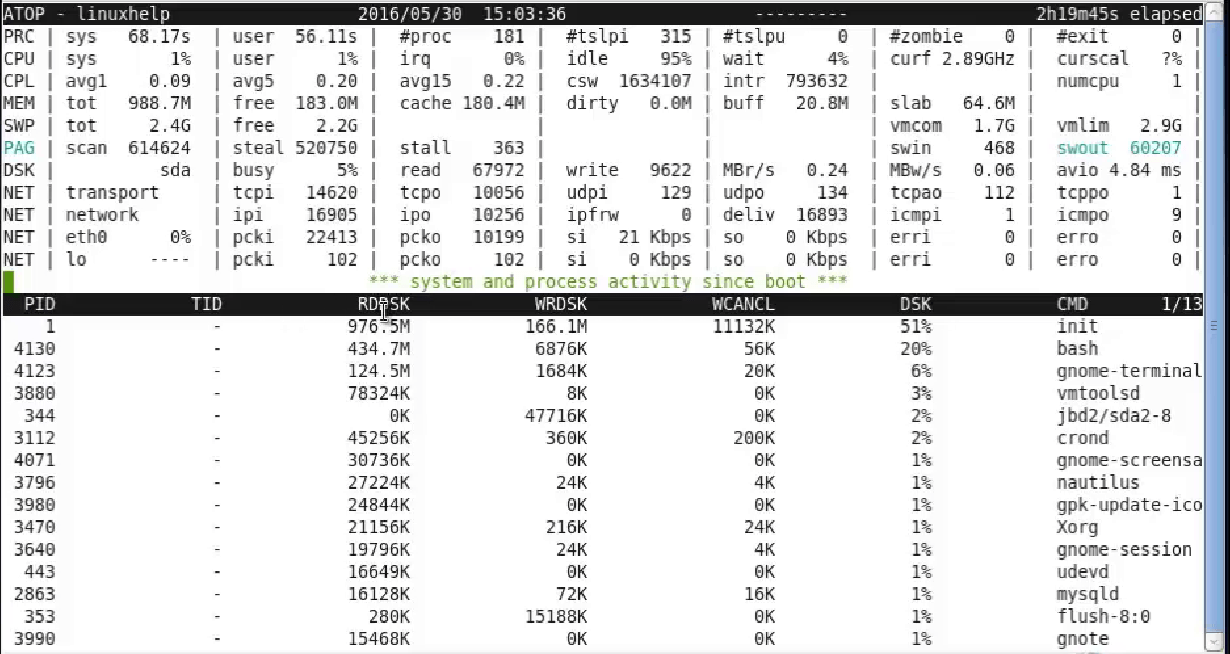
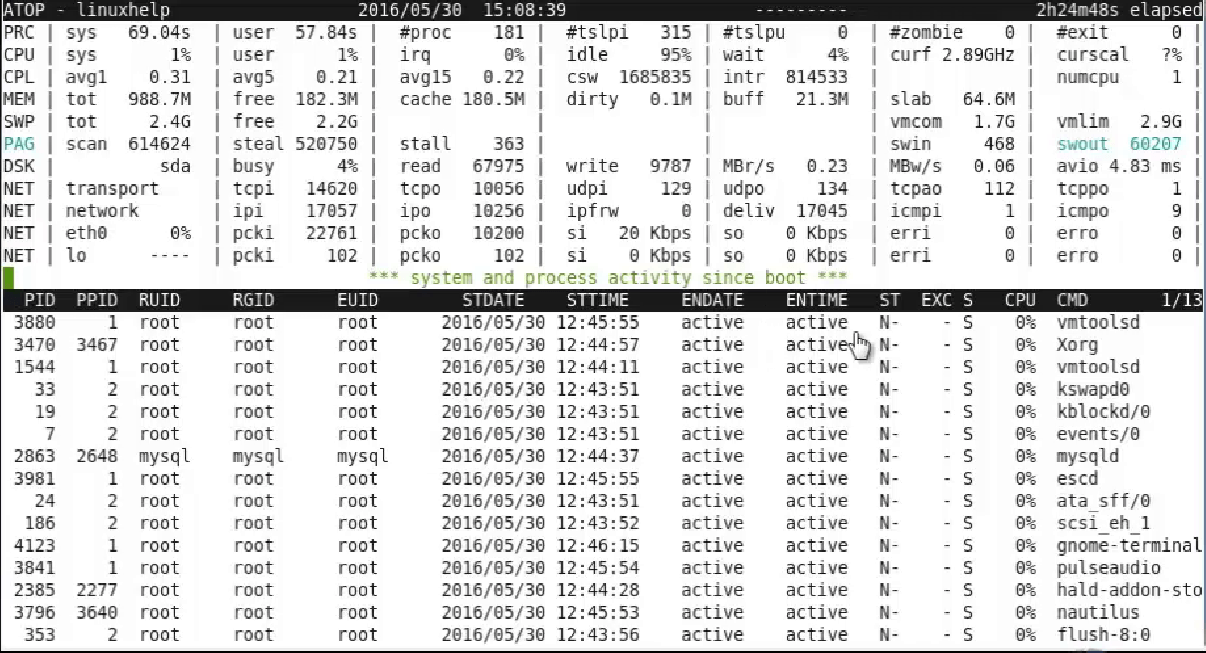
Using ‘ v’ option
It shows the variable information about the running processes like uid, pid, rgid ,etc..
[root@linuxhelp Desktop]# atop -v
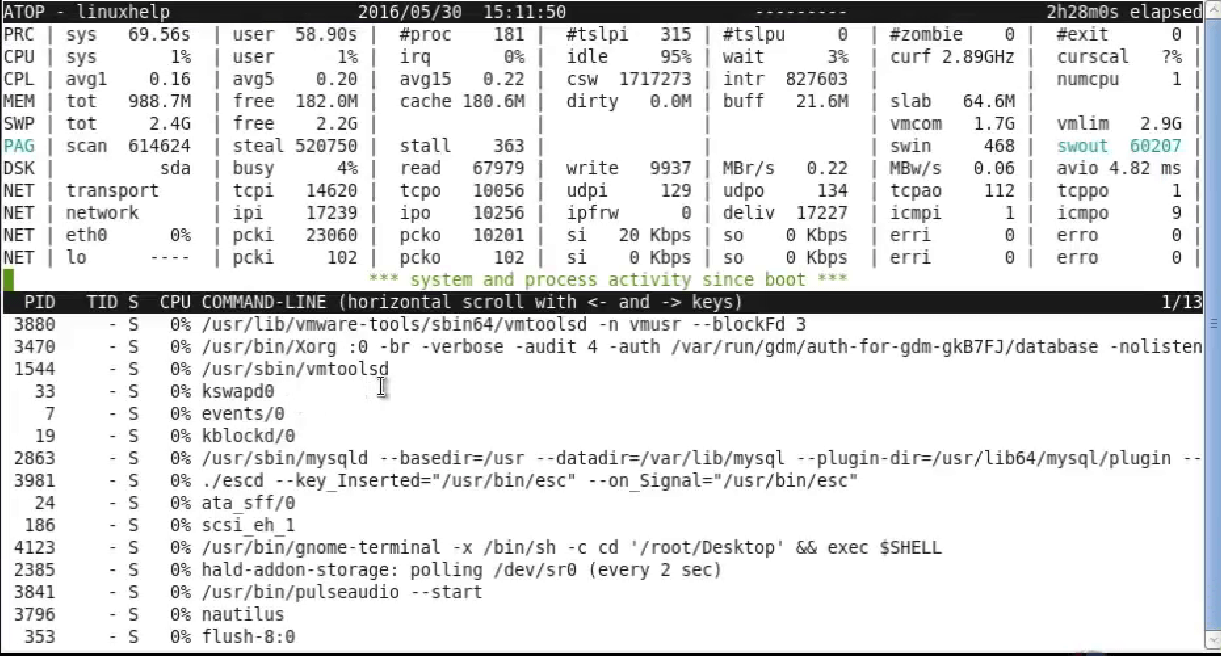
Using ‘ c’ option
It shows the commands running with PID in detail.
[root@linuxhelp Desktop]# atop -c
Using ‘ p’ option
It shows the window accumulation per program. The most right column shows which programs are active (during the intervals) and the most left column shows how many process they have spawned.
[root@linuxhelp Desktop]# atop -p

Using ‘ u’ option
This screen shows which users were/are active during the last interval and indicates how many processes each user runs/ran.
[root@linuxhelp Desktop]# atop -u

Using ‘ y’ option
It will display the single or multiple threads of the all running process.
[root@linuxhelp Desktop]# atop -y
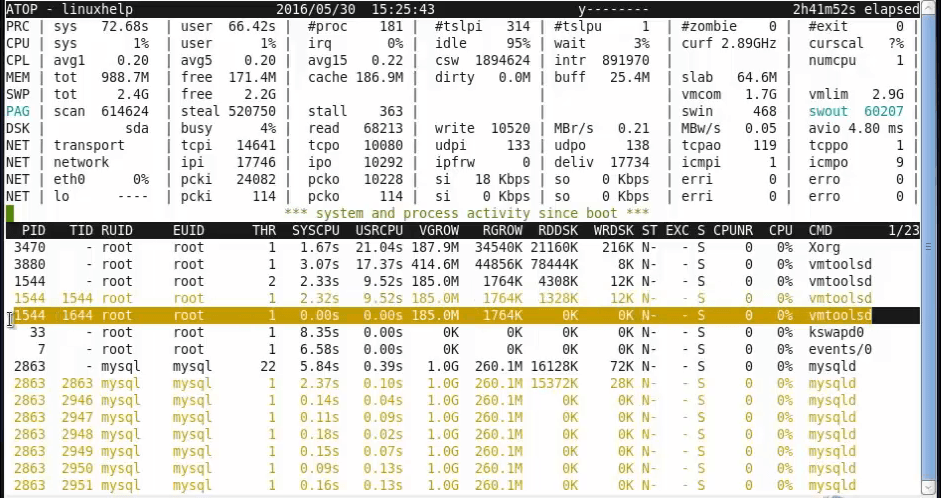
Using ‘ o’ option
It shows the user defined line of process.
[root@linuxhelp Desktop]# atop -o

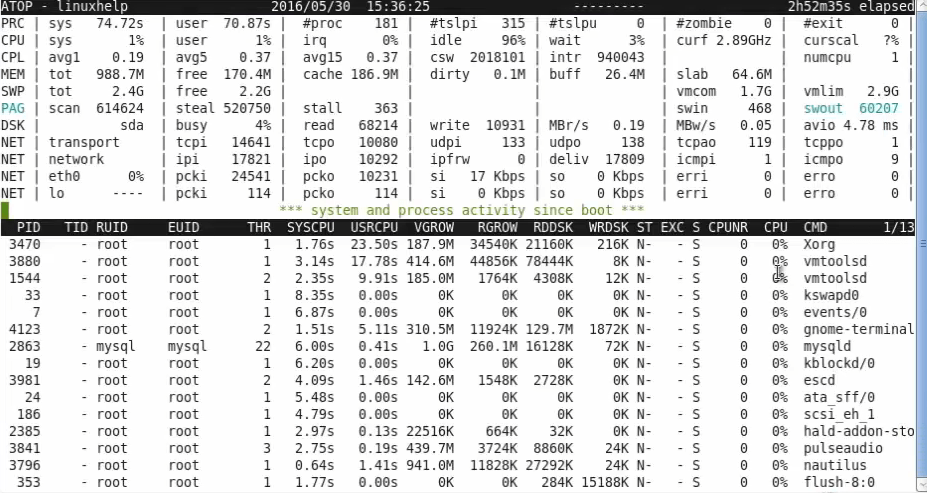
Using ‘ C’ option
It will Sort the current list in the order of CPU consumption
[root@linuxhelp Desktop]# atop -C
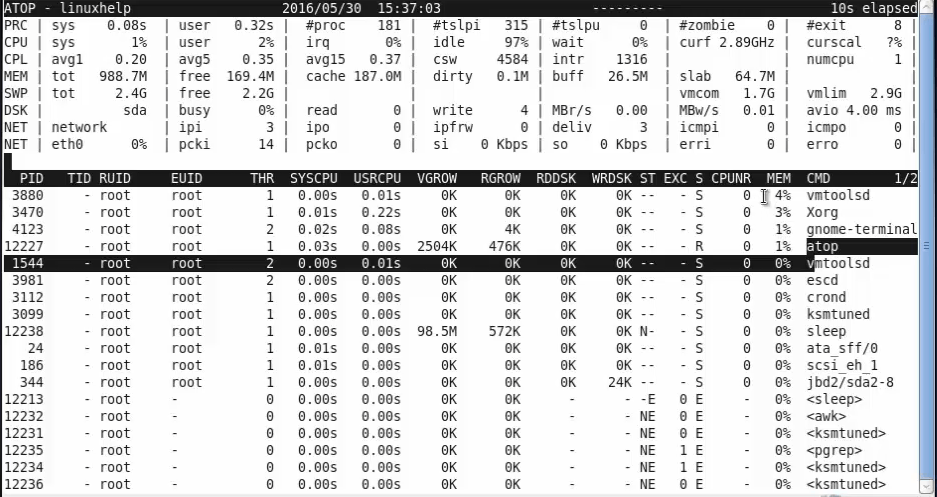
Using ‘ M’ option
It will Sort the current list in the order of resident memory consumption.
[root@linuxhelp Desktop]# atop -M
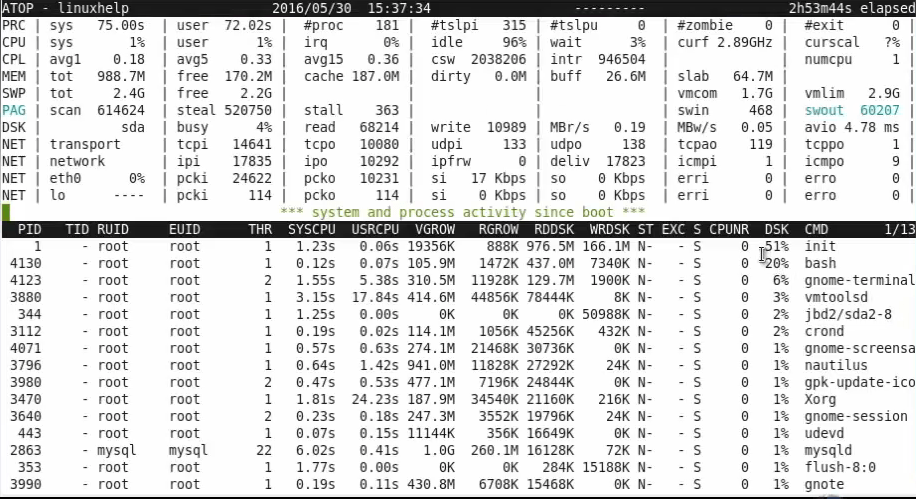
Using ‘ D’ option
It will Sort the current list in the order of disk accesses issued.
[root@linuxhelp Desktop]# atop -D
Command to check the version of atop
[root@linuxhelp Desktop]# atop -V
Version: 1.27-3 - 2012/07/22 11:38:52     <  gerlof.langeveld@atoptool.nl >
Comments ( 0 )
No comments available