How to install and use IPTraf in Linux
To install and use IPTraf Tool
IPTraf is an IP LAN monitoring tool based on ncurses, which is used to monitor connections such as UDP, TCP, ICMP, etc. Real Time Interactive IP LAN Monitoring with IPTraf Tool installation is explained in this manual.
To Install IPTraf
For Ubuntu
Run the following ‘ apt-get‘ command for its installation.
root@linuxhelp ~$ sudo apt-get install iptraf
For CentOS, RHEL and Fedora
IPTraf is part of the Linux distribution which can be installed on CentOS, RHEL, and Fedora server’ s by executing the following command.
[root@linuxhelp ~]# yum install iptraf -y
Loaded plugins: fastestmirror, langpacks
Loading mirror speeds from cached hostfile
 * base: centos.excellmedia.net
 * extras: centos.excellmedia.net
 * updates: centos.excellmedia.net
Resolving Dependencies
-->  Running transaction check
--->  Package iptraf-ng.x86_64 0:1.1.4-4.el7 will be installed
.
.
.
Installed:
  iptraf-ng.x86_64 0:1.1.4-4.el7

Complete!
Now the installation of IPTraf is completed.
Usage of IPTraf
In the terminal, execute the below command to start an ASCII based menu interface which will allow to see the present IP traffic monitoring, Detailed interface statistics, General interface statistics, Filters, Statistical breakdowns, and also gives some configure options.
[root@linuxhelp ~]# iptraf
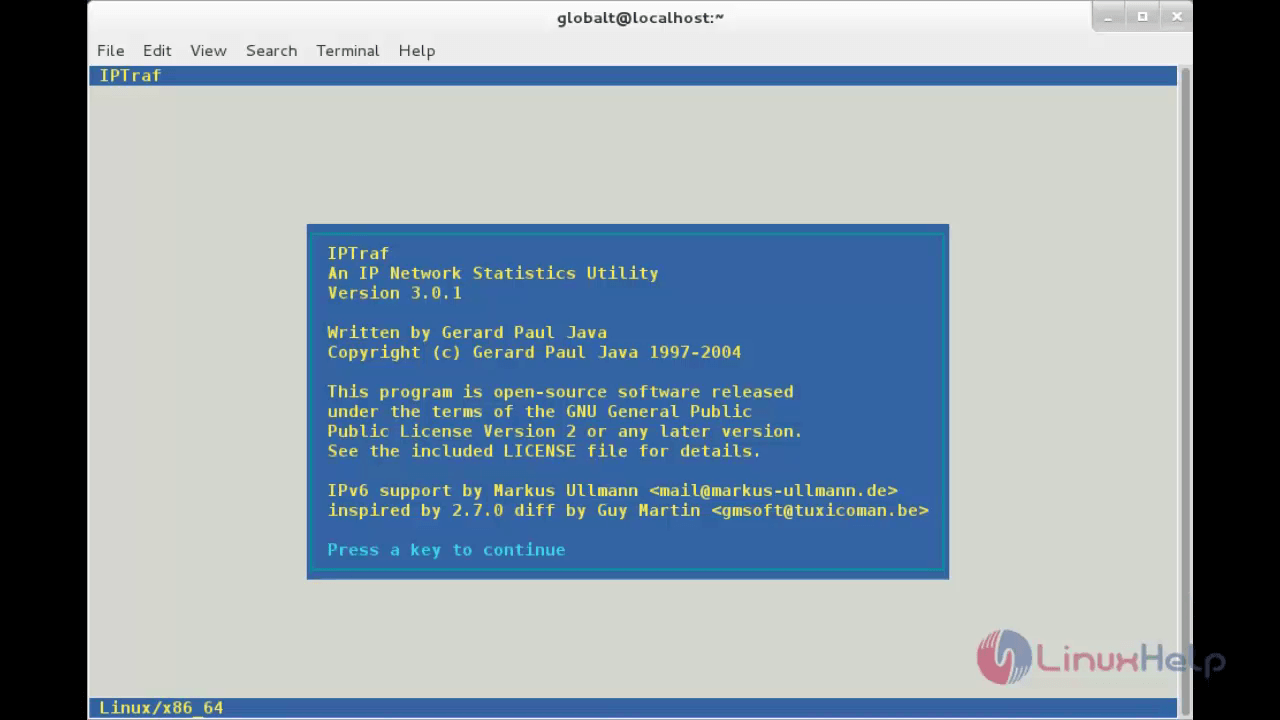
A menu system is displayed by the iptraf interactive screen with various options to choose from. The real time interface statistics and IP traffic are shown in the following screenshots.
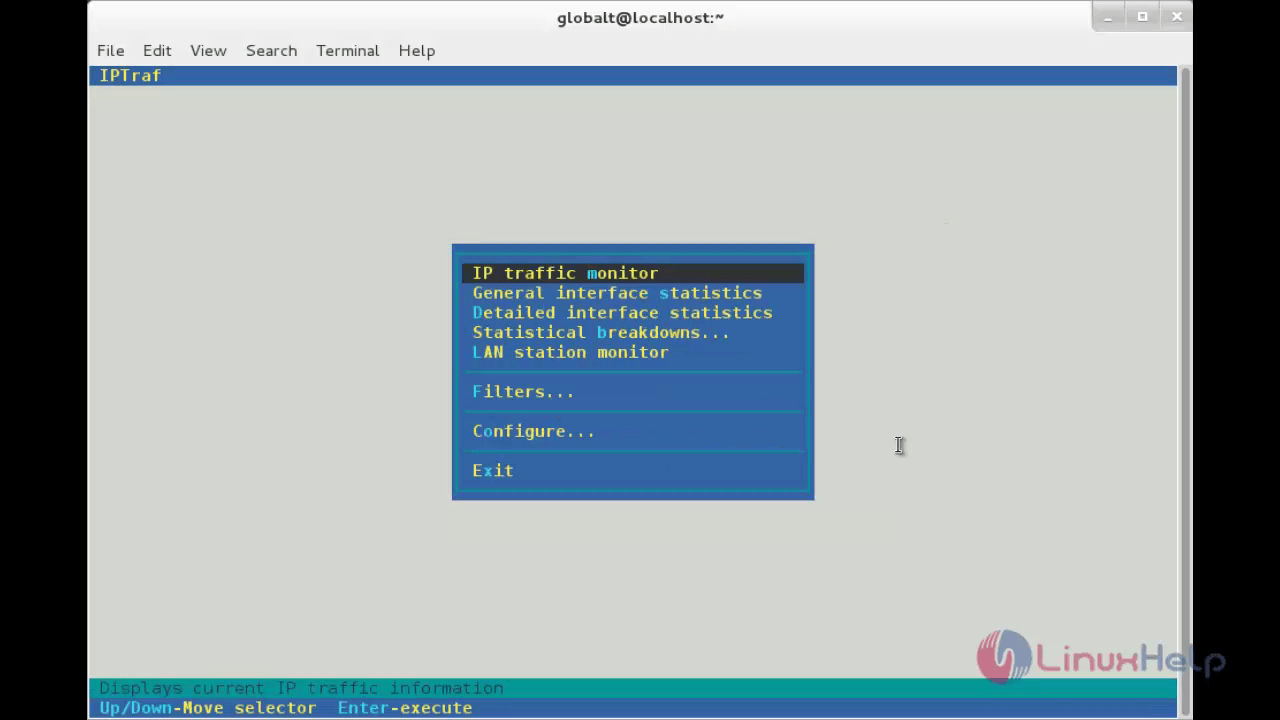
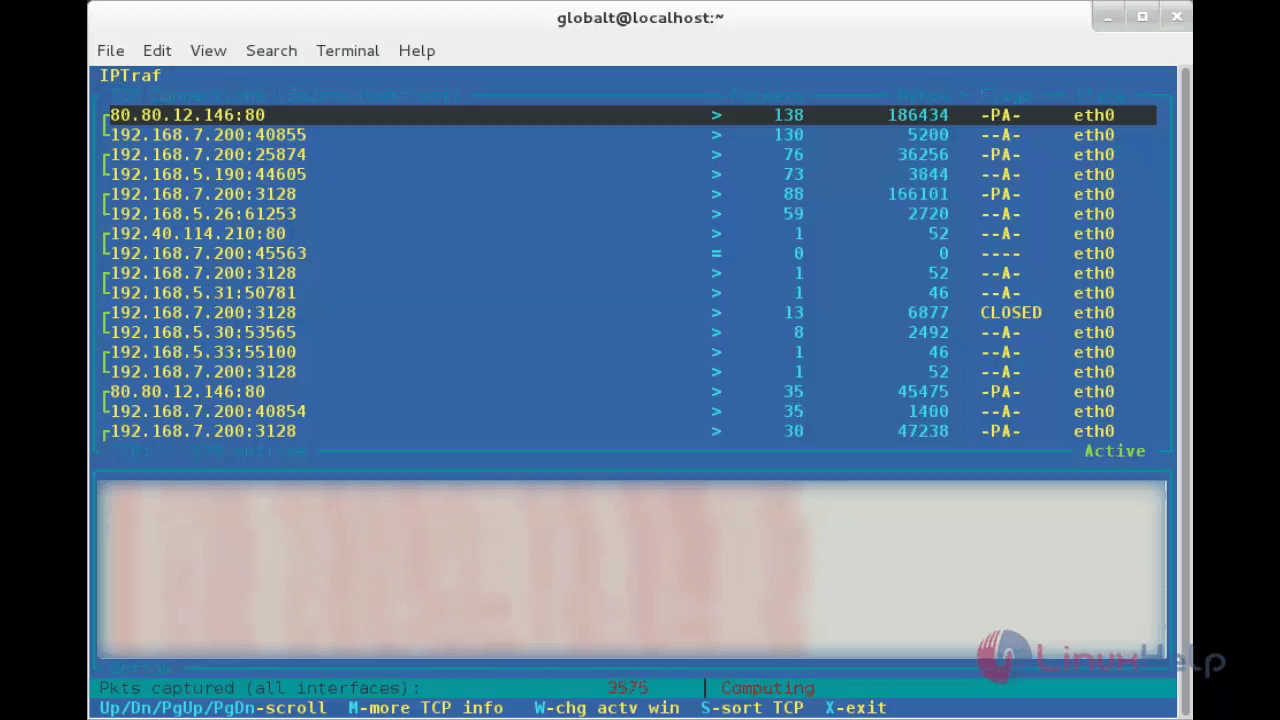
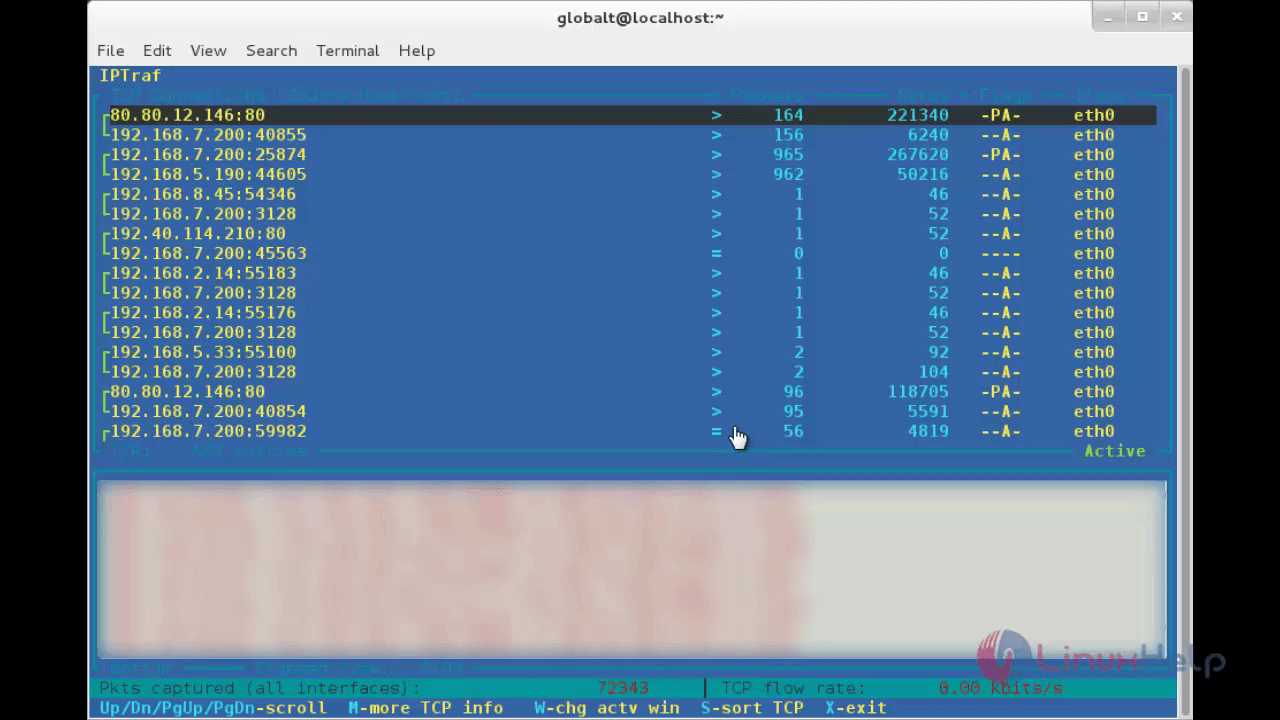
IP traffic monitor Screen
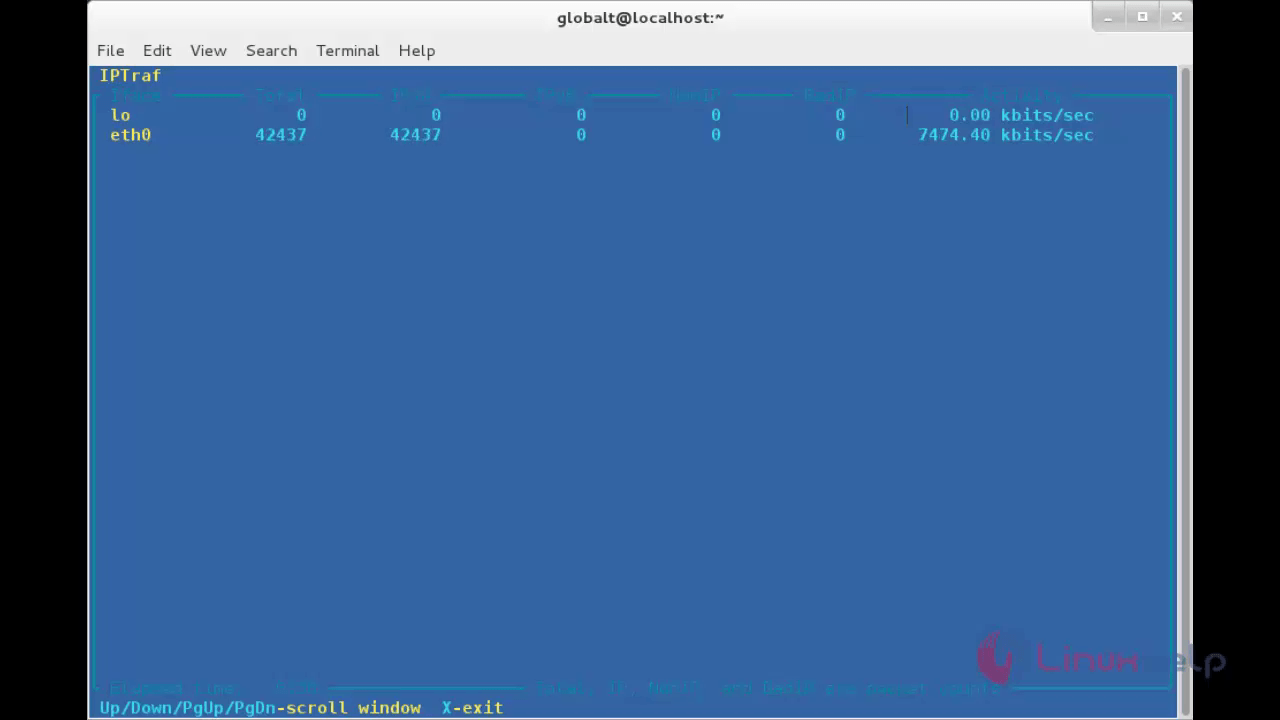
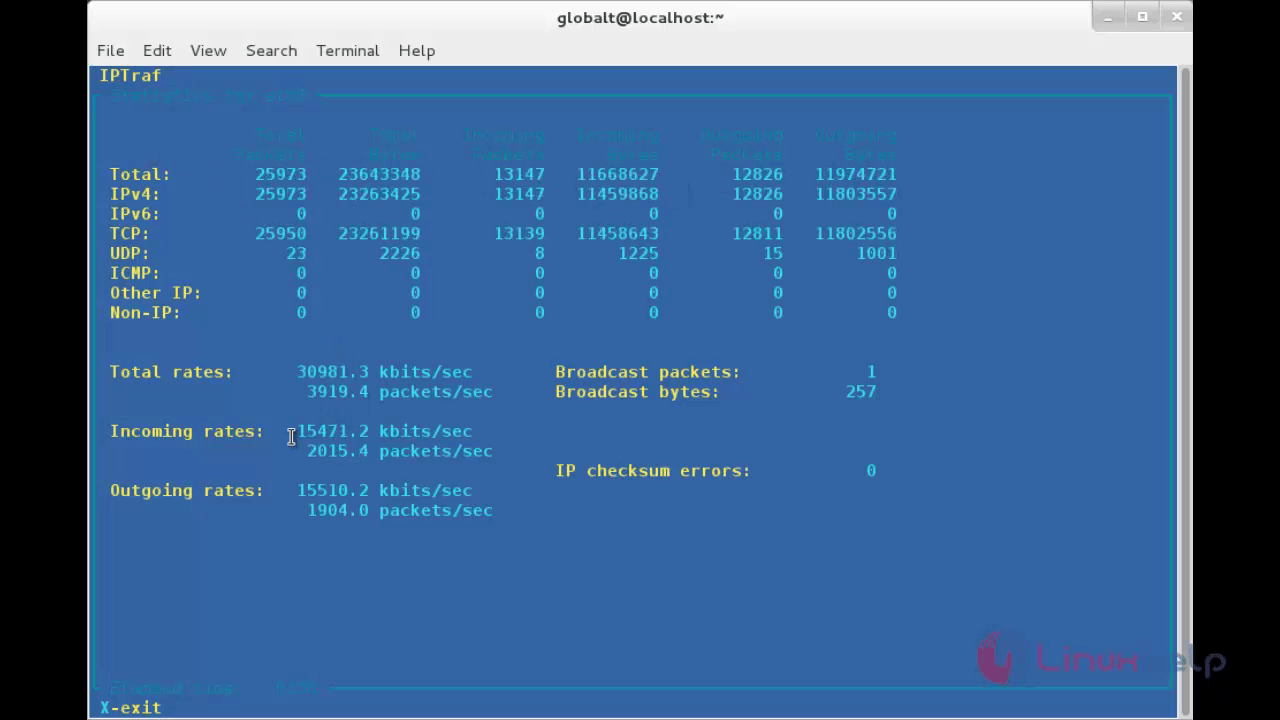
General interface statistics Screen
Detailed interface statistics Screen
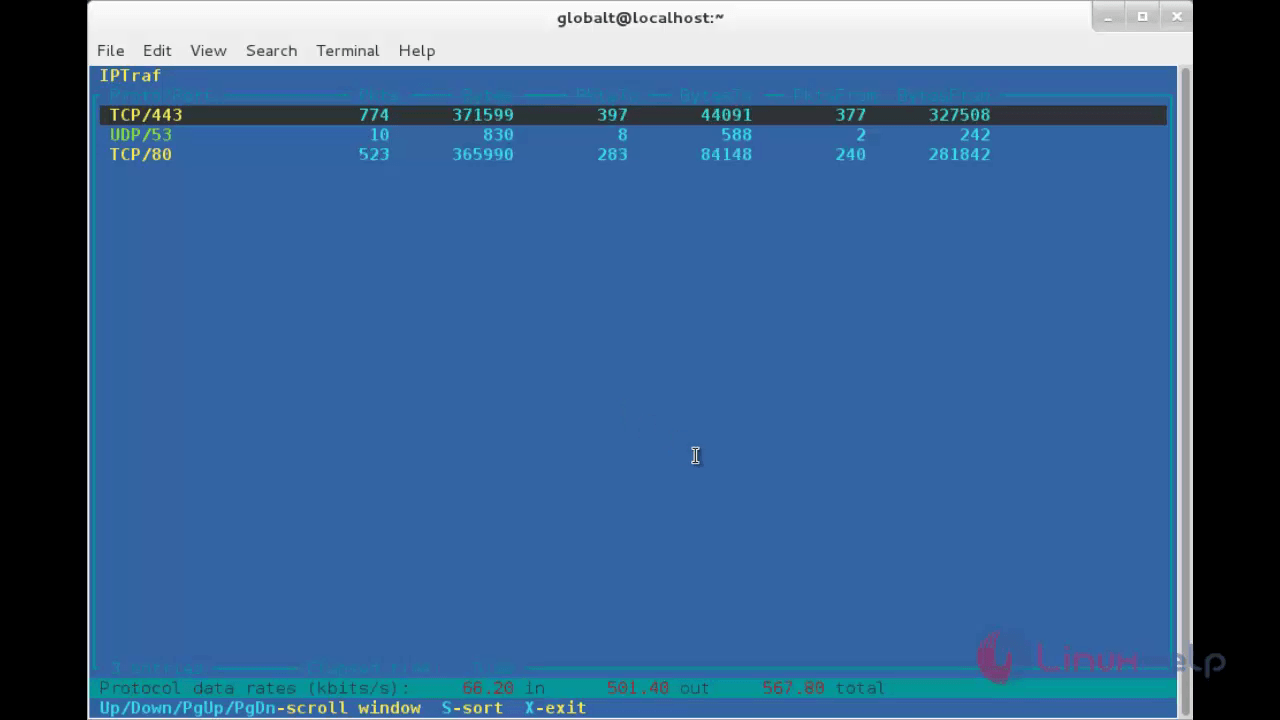
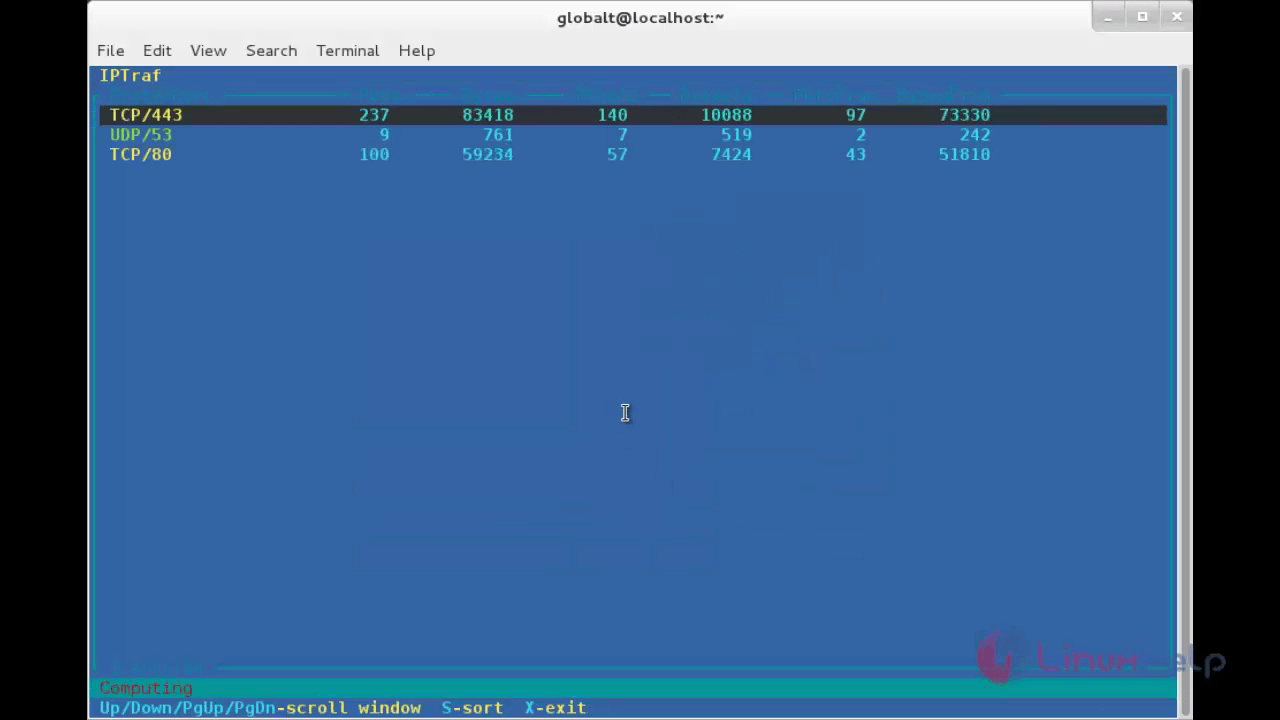
Statistical breakdowns Screen
1. By packet size

2. By TCP/UDP port
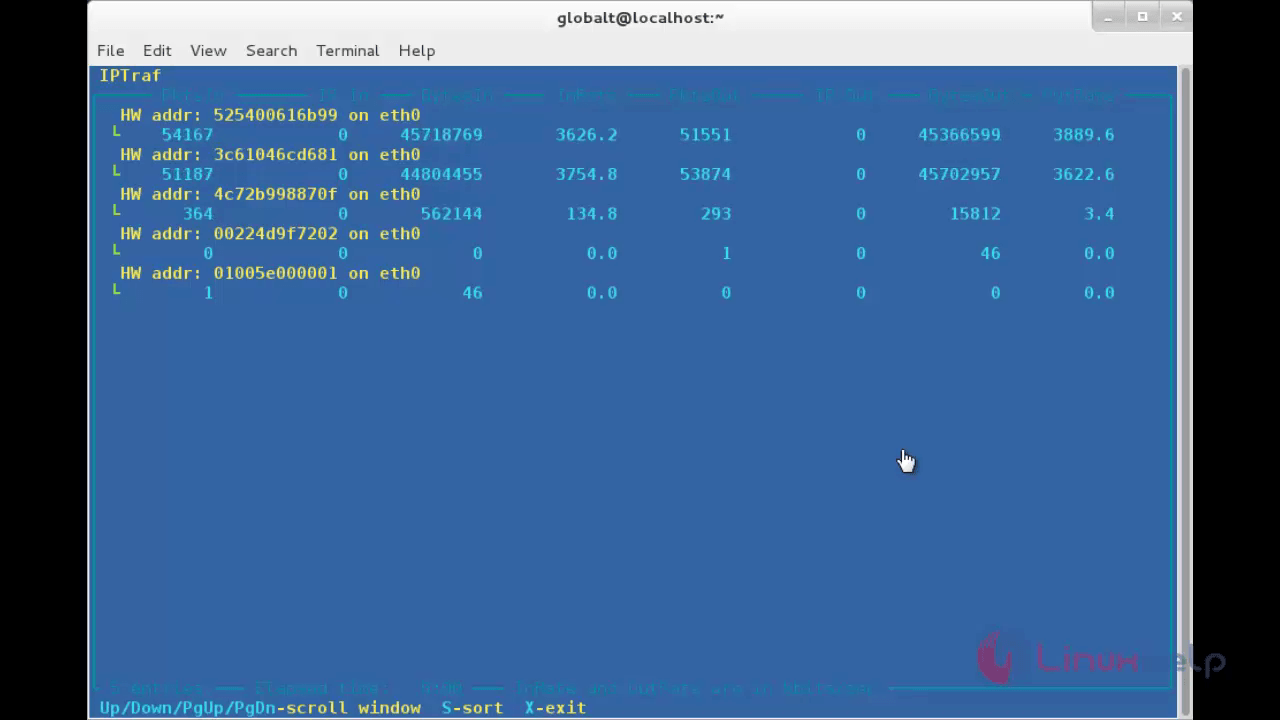
LAN station monitor Screen
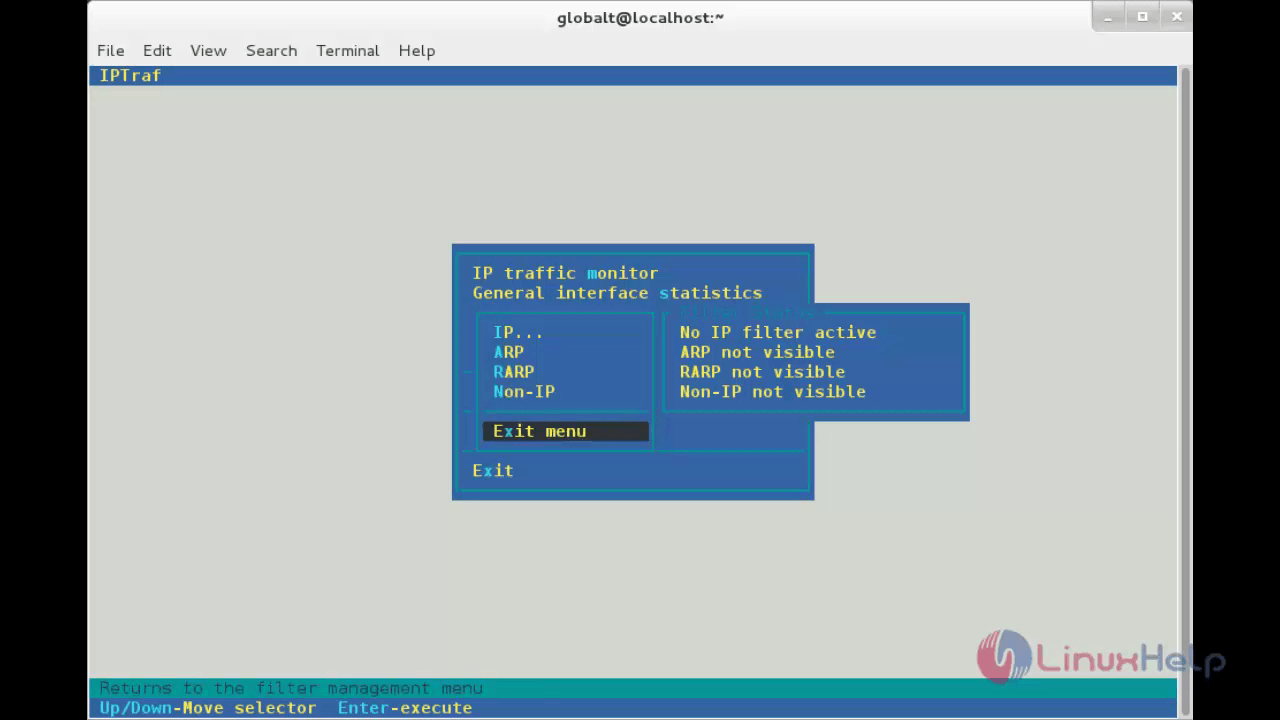
Filter Screen
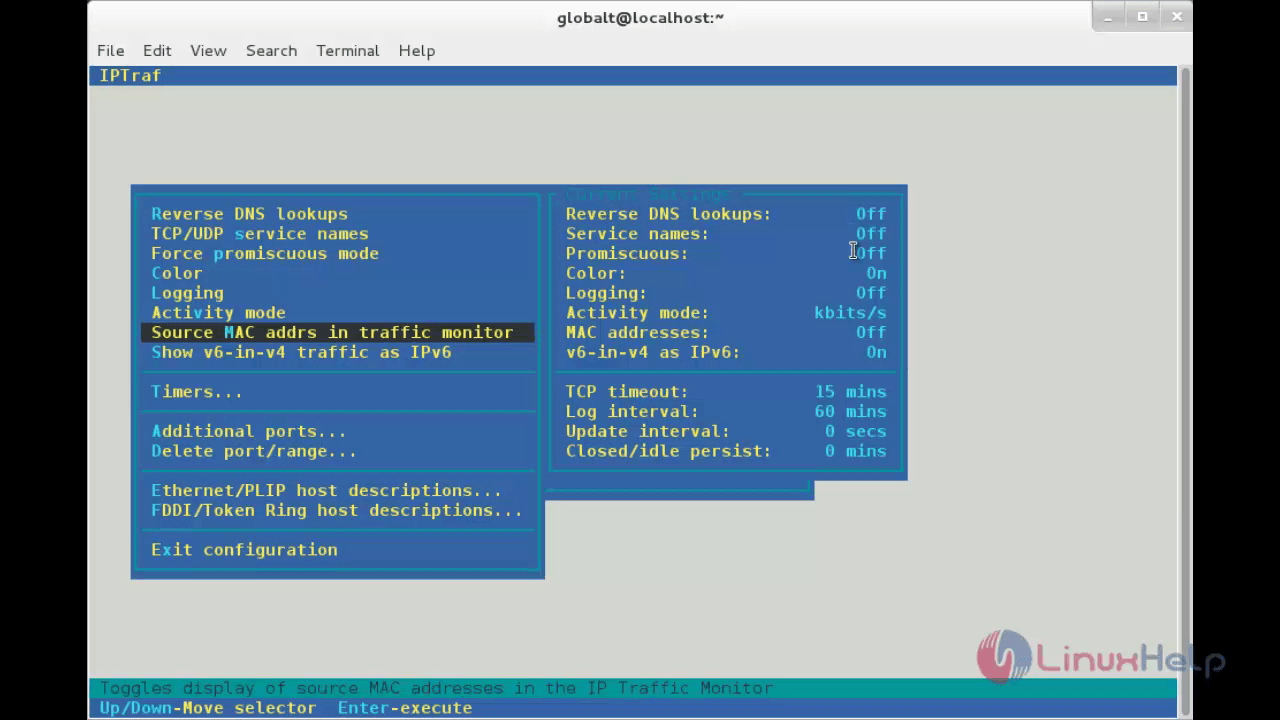
Configuration Screen
Various Options for IPTraf
To start the IP traffic monitor on a specific interface, run “ iptraf -i” .
[root@linuxhelp ~]# iptraf -i eth0
Use the following command, to monitor TCP/UDP traffic on a particular interface.
[root@linuxhelp ~]# iptraf -s eth0


Comments ( 0 )
No comments available